Chart Pattern #10: Symmetrical Triangle
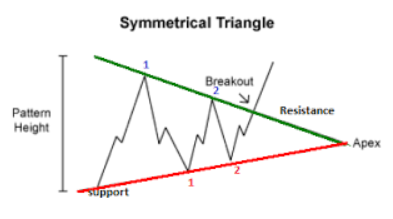
A symmetrical triangle is a chart pattern where the slope of the price’s highs and the slope of the price’s lows meet at a point where it forms a triangle of equal length.
This formation means the market is making lower highs and higher lows.
To explain that subtle oxymoron… this means the buyers and sellers are still stuck in a tug-of-war stalemate.
No one’s pulling hard enough to make a clear trend.
That explains the wedges or price resistance between the initial trend line and support level as seen below.

What Does This Mean For You?
According to technical analysts, roughly 75% of symmetrical triangles are continuation patterns and the rest mark breakouts or reversals.
As you can see, the initial uptrend forms a trendline and support level that converges evenly, so it’s hard to confirm whether there will be a bearish or bullish breakout.
This is what separates symmetrical triangles from ascending and descending ones.
But what you should know is that the market will break out regardless.
How To Trade the Symmetrical Pattern
That means you have to place your entry orders above the slope of lower highs and below the higher lows of the symmetrical triangle.
So you’ll have to place entries that anticipate rallies or short the asset.
The Risks Involved
Symmetrical Chart Pattern is like an undecided voter — it doesn’t really know which way it’s leaning yet.
But even the undecided voter votes eventually. The same goes for traders who have to accept the risks and make a move when they have enough information.
You may have to wait for several more weeks for a better-looking pattern, pass up on this movement, or just place your entry points and hope for the best.
But if you’re tired of all that guesswork, we’ll take care of it for you. Just click here to access the free training on how to make $34,680.77 every 13 days.


