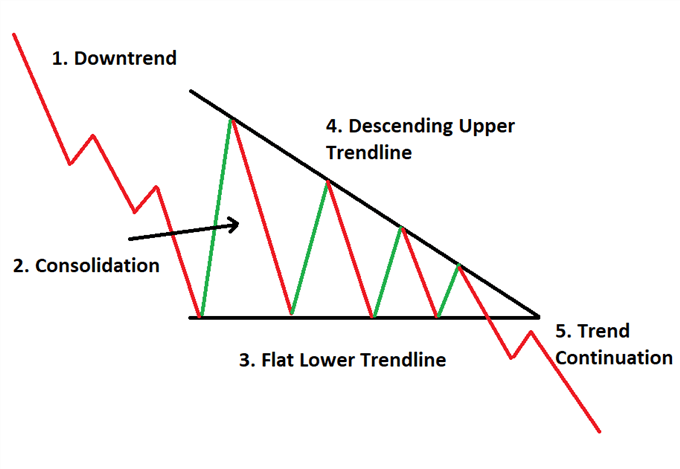
Chart Pattern #9: Descending triangle
The descending triangle shows a bearish pattern with a continuing trend that breaks past the support level that results in a new downtrend.
In layman’s terms…
The sellers got really aggressive in tug-of-war and forced the price to even lower levels.
The pattern is fully formed when there is an initial downtrend which connects the descending trendline and the flatline (support level) with price resistance that leads to that lower trend continuation as seen below.
What Does This Mean For You?
Technical analysts use this chart to measure the distance from the highest point of the downtrend to the start of the flatline. This is used to confirm entry points or shorts for profit targets.
For example…
After recording a lower high just below 60 in December 1999, Nucor formed a descending triangle early in 2000. In late April, the stock broke support with a sharp break and increase in volume to complete the formation.
Since the highest point of the initial downtrend was at 60 and the flatline was confirmed at 45, Analysts projected the rate of resistance in the downtrend to be 15. Thus the continuation trend could hit as low 30.
How To Trade a Descending Triangle
Because this involves technical analysis, you have to make sure you find all the parts that form a descending triangle.
You must:
- Identify the initial downtrend
- Measure the distance from the start of the descending trend line from the start of the flatline
- Confirm resistance is in a bearish market
- Short at the initial start of the continuation trend
- Set your stop-loss in case of a false breakout or trend reversal
The Risks
Although this is an easy pattern to identify, it’s also subject to false breakouts.
Manage your risk accordingly.
Or better yet, allow me to show you exactly how to manage the risks on each trade you take with the Big Energy Profits methodology — click here to watch a free video training and learn how!

Author: Anthony Speciale
Anthony Speciale Jr. Born and raised into a blue collar family in the suburbs of Northern New Jersey, I have in recent years put down the wrenches I’ve been turning for the better part of my entire life and have become a professional energy trader. My mother was a nurse practitioner and my father was an auto mechanic. I had literally watched both of my parents work endless hours with their hands throughout their entire lives and after loosing my mother at a young age to cancer, I had decided I wanted a different future than the path I was currently on. At a young age I was a struggling student who didn’t excel very well academically and college wasn’t really in the cards for me, but I was always a disciplined worker. When I had put my mind to something, there was nothing that was going to stop me from reaching and exceeding my goals I had set for myself. So, as life had evolved, so did my desire for freedom. It was never much about the money for me, but it was about the success and the freedom that accompanied that success. Over a decade ago, I decided to specialize in just one sector of the market. I knew that I only needed to be proficient at just one area of the market to achieve the goal I had set forth. Trade passively while producing massively. Well, that’s exactly what I did. After several years of failed attempts, endless education, trial and error - I had finally yielded myself the success and freedom I was desiring. After making myself over $1,000,000.00 trading this very method, it was time to share my success with those who also desire the freedom I did. After a lot of work, time, effort and sacrifice - Big Energy Profits went from merely a concept into a very real reality.