

There are several tools to leverage opportunities in the financial markets.
For example, yesterday, we discussed three “candlestick patterns” for predicting price movements and identifying support and resistance levels.
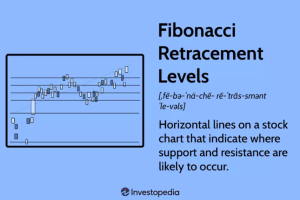
Today, we’ll briefly discuss Fibonacci retracement levels.
This tool is popular due to its ability to identify possible market reversal zones, which provides vital insight into executing the best trades for better outcomes.
Origins:
The Fibonacci retracement tool is derived from the Fibonacci sequence, a mathematical concept created by Indian mathematicians and then popularized in Western Europe by the famous Italian mathematician Leonardo of Pisa — also known as Fibonacci — in the 13th century.
This Fibonacci sequence follows a pattern you’re likely familiar with.
Each number in the sequence is the sum of the two preceding ones…
(0, 1, 1, 2, 3, 5, 8, 13, 21, and so on).
It’s pretty similar to the numbers in Fibonacci retracement levels:
(23.6%, 38.2%, 50%, 61.8%, 100%, etc).
Dividing one number by the next yields 0.618, or 61.8%.
Divide a number by the second to its right, and you get 0.382 or 38.2%.
All the ratios, except for 50% (which isn’t an official Fibonacci number), are based on mathematical calculations involving this number string.
Trading applications:
Fibonacci retracement levels — represented as horizontal lines on trading charts — are calculated by identifying the high and low points on a chart.
As highlighted above, you can use Fibonacci retracement levels to place proper entry orders, determine stop-loss levels, or set unique price targets.
For example, if the price of a stock increases by $10 and then drops $2.36…
It has retraced 23.6%, which is a Fibonacci retracement number (level).
Also, you may see a stock moving higher…
After a move up, it retraces to the 61.8% level and starts going up again.
Since the bounce occurred at a Fibonacci level during an uptrend, you can then decide to buy and set a stop loss at the 61.8% level.
Why 61.8%?
Because a return below that level could indicate that the rally has failed.
You can also use Fibonacci retracement levels to identify where an asset might “retrace or extend” before continuing upwards or downwards.
For example, a stock goes from $5 to $10, then back to $7.50.
The move from $10 to $7.50 is a retracement.
If the price starts rallying again and goes to $16, that’s an extension.
In that case, $7.50 could be the retracement level to watch.
In general, Fibonacci retracement is a valuable tool in technical analysis.
But when you combine it with other technical analysis tools…
You get better insight into market trends and price movements that positions you to execute more high-probability trades for better financial results.
We’ve used this approach to take profits twice on our USO position this past week. And we’ve started taking profits on another trade in the retail sector.
But that’s just the tip of the spear.
There are more opportunities to harness when you look in the right places.
For more insight, see how to target double-digit gains with this approach.
Wishing you a blessed and profitable day,


